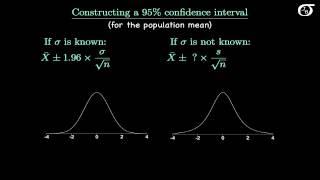
Introduction to the t Distribution (non-technical)
Комментарии:

watching this videos I have several times "oh syiiiiiiiit so that's why!" moment cuz this answers a lot of questions in my mind, thank you!
Ответить
The way you present lessons with 2 fonts at most && black bg is immaculate.
Ответить
Good at every point, your discrete explanation gives good understanding. thank you for making this out.
Ответить
Thank you.
Ответить
Blessed to have a concept clearer like you...(Don't go for the grammar😋😅)
Ответить
Thank you 🙏 👌👌👌👌👌👌
Ответить
Knowledge is valueable, what!'s more valueable is the actions that are taken to expel the popular wrong-doings in the realm of knowledge. It's decisions of courage and decency.
Use t test no matter how big your sample is!

this saved me lol thanks
Ответить
Any good book for statistics?
Ответить
So that means if we possess the standard deviation of a population we can get away with a smaller sample size (we just have to iterate the process for large number of times , courtesy Law Of Large Number) , but if it's not known then , bigger the sample size the better it is ?
Ответить
Good work
Ответить
What a video. You are very very good! No more confusion for me.
Ответить
Pure gold! Thank you so much!!
Ответить
great lesson
Ответить
شكرا جدا
Ответить
you explained this better than khan academy! thank you so much :)
Ответить
Dont we have to take that sample mean x bar that correspond to 1.96. or else we will not get the correct population mean. Please someone make this clear
Ответить
Yep. Pretty standard in statistic courses to use the n>= 30 rule because of the central limit theorem as well. The heuristic put forward is that the sample distribution of the sample mean is close enough to a normal distribution centered at the population mean with its corresponding standard error. But I saw how some of those histograms look for the sampling distribution for around 30 and what the rule doesn’t tell you is that, if your underlying population was pretty close to normal already then of course the n>30 sampling distribution would be close to a normal distribution too! But if you had something heavily skewed, even with n>100 the sampling distribution is nowhere near that bell shaped curve we all know and love. So I actually agree with you here, I’d rather use the student-t distribution, when I can assume normality, regardless of the sample size. It’s just more accurate!
Ответить
It was so helpful for me. Great video
Ответить
Your videos are so incredibly clear. I am a statistics graduate student, and watching even very basic videos like this one is still helpful to solidify concepts because of how well you communicate and visualize concepts. Thank you!
Ответить
The best
Ответить
Thanks for this
Ответить
I have being confused on this so long since there are plenty of different explanation from different resources. But you make a really good conclusion which help me figure out when is the proper time to use Z or T ststics. Thank you so much.
Ответить
A heroic explanation of high quality. Thanks for help with the FE exam!
Ответить
Thanks to you!
Ответить
How do we the degree of freedom
Ответить
thank you ! great video
Ответить
Thank you! The explanation was very good.
Ответить
Such a simple and lucid explanation. Thank you so much!
Ответить
The only thing I don't understand is how the probability distribution of (Xbar-μ)/(s1/√n), a variable whose value would depend on a single sample's statistic s1, can be a t distribution which is a fixed curve for a given dof (n-1). There is nothing fixing s1, and it can be any s1 from any single sample of size n. So wouldn't choosing a different s1 yield different distributions for a given sample size?
Ответить
Wow, this was amazing, thank you! but I have a question: I've seen the z-stats formula as divided by the sd only (not by sd / squared root of n)...why is that?
Ответить
Loved your explanation
Ответить
I love you
Ответить
X bar and mew both are means you were suppose to write x-mew
Ответить
Great videos. I think that the idea of using the normal distribution to approximate the student t distribution for large sample sizes comes from the days before computer software, when statistitians had to rely on mathematical tables. Such tables had to have different entries for each degree of freedom, and would be computationally expensive to produce if they included entries for degrees of freedom beyond a certain threshold. Hence the rule of thumb for sample sizes greater than 30.
Ответить
❤
Ответить
extremely well explained, thank you so much
Ответить
i swear to god statistics videos are so hard to watch
i watch 30 seconds before taking a break

i am genuinely asking, do these formulas help in the real world? (no offence to any mathematician)
Ответить
This was so helpful! Thank you so much!
Ответить
Was fantastic explanation. Thank you!
Ответить
I was so afraid to ask my statistics teacher why we change to t statistic when we sample size is bigger than 30, I thought either it'll be too stupid to ask, or it'll be too difficult to understand. Thanks'
Ответить
Quite helpful thanks for uploading it
Ответить
Excellent, thank you
Ответить
Thank you so much for these amazing explanations.
Ответить
My statistics professor just had me derive the t distribution on a homework question by taking a Chi-Square distribution Y with some amount “m” degrees of freedom and a zero-mean Gaussian variable X with a given variance, and find the PDF of T = X / sqrt(Y), and I got the answer, and he then revealed “this is the famous Student’s T Distribution”, but I had no idea what that meant
Ответить


